Bitcoin Surges to Over $60K, Eyes Potential Breakout as Technical Indicators Align

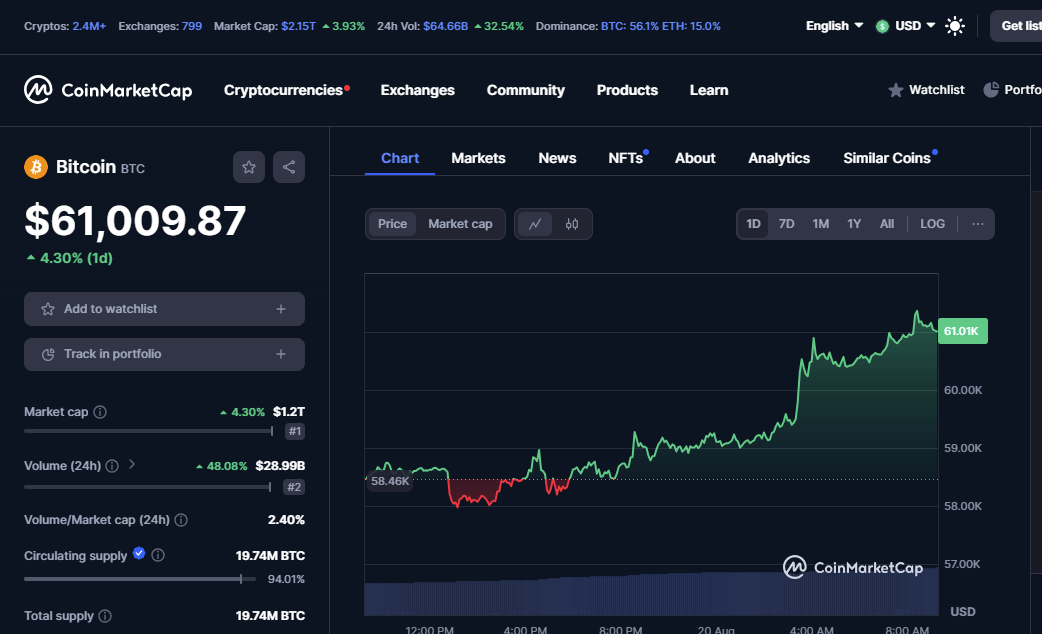
- Bitcoin’s price rose to $61,009.87 with a 4.3% increase showing strong investor confidence.
- Technical signs suggest Bitcoin could change past $65,000 and trigger a beneficial run.
- Sales experts are closely watching Bitcoin’s next move as key levels are being tested for a possible breakout.
The price of BTC has grew to $61,009.87, which is reflecting a 4.3% increase over the past 24 hours. The currency is currently positioned as the first one in terms of market capitalisation, standing at $1.2 T over the previous day . This in turn indicates high investor interest and perfect market engagement. The one-day chart represents a positive trend, with Bitcoin’s prices climbing steadily. Starting from a low price of $58,460, the coin has experienced some volatility, but it ultimately gained momentum, which has surpassed the $60,000 mark and closed at $61,009.87.


Source : coinmarketcap
This price movement is a clear indication of the growing confidence among investors, as Bitcoin’s dominance remains a strong pillar in the industry, as it is at 56.1% in the overall crypto market. Additionally, Ethereum holds a 15% dominance, which further emphasises Bitcoin’s leading position. With the market capital of the entire crypto business now standing at $2.15 trillion, Bitcoin’s performance is important in driving overall economy sentiment.
Bitcoin’s Price Pattern Indicates Potential Breakout as Technical Indicators Align
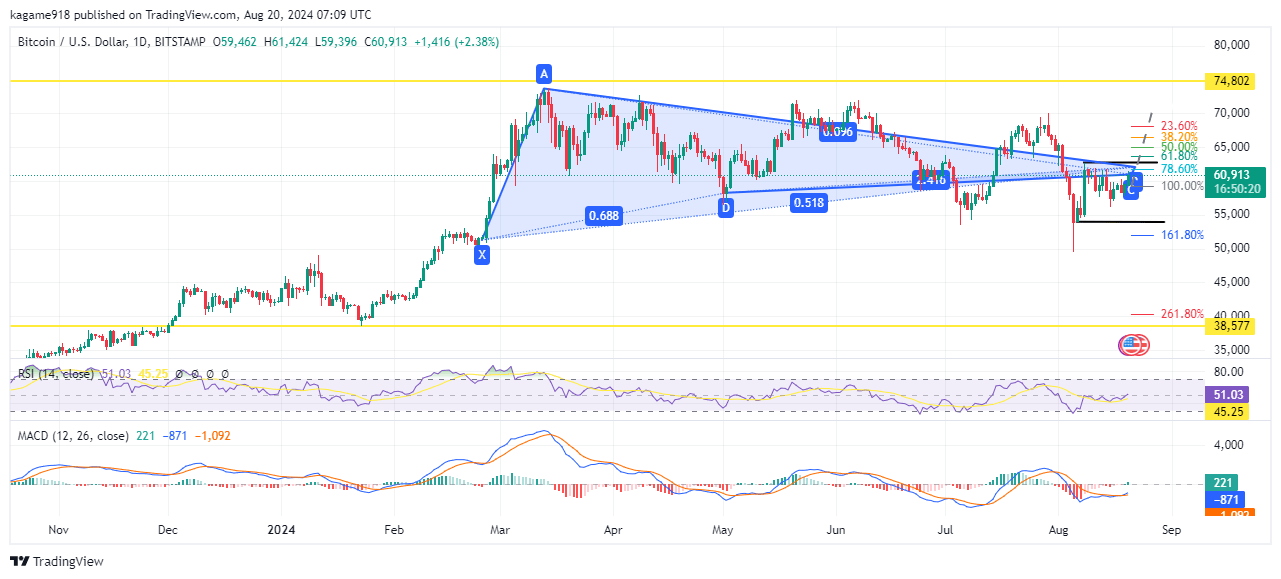
In terms of technical analysis, the symmetrical triangle structure on Bitcoin’s chart indicates a critical format that points to a possible breakout. It is marked by points labelled X ,A , B, , C, and D, which have also highlighted key support and resistance levels.
The price currently hovers around $60,913, showing a 2.38% increase for the day. The symmetrical pattern, which is commonly associated with a period of consolidation before a breakout when it is nearing its apex, As bitcoin approached the critical resistance level around $65,000, traders were closely watching for a potential move that could push the price higher..
Global Liquidity is about to break out #Bitcoin is about to explode pic.twitter.com/5Q41zRuy9L
— Quinten | 048.eth (@QuintenFrancois) August 19, 2024
A good example is how the analyst @QuintenFrancois posted on the X platform that Bitcoin has been facing potential breakouts with peaks and higher resistance points. He points out that the market is about to rise due to its continuous bullish sentiment.


Source: Tradingview
Technical indicators are also in support of this bullish outlook, as the RSI is positioned at 51.03, just above the neutral zone, which indicates that bitcoin is neither overbought nor oversold, thus leaving room for more upward movement. The MACD is also showing a more bullish outlook. This is showcased by the coincidence of both the signal line and the MACD line showing a possible price breakout in the near future. Furthermore, the Fibonacci retracement levels have applied recent price swings, showing that bitcoin is currently testing the 78.60% retracement level, which is a key resistance point.
A breakout above this point could pave the way for Bitcoin to challenge its previous highs near $74,802. The market trends show an optimistic outlook, as if Bitcoin surpasses the triangle pattern, it could signal the beginning of a new and strong bullidh phase.


 Bitcoin
  Ethereum
  Tether
  USDC
USDC  Dogecoin
  TRON
TRON  Cardano
  Stellar
  Chainlink
  Hedera
  Bitcoin Cash
  Litecoin
  LEO Token
  Monero
  Cronos
  Dai
Dai  Ethereum Classic
  OKB
OKB  Algorand
  VeChain
  Cosmos Hub
  Gate
Gate  KuCoin
  Stacks
  Tezos
Tezos  Theta Network
  IOTA
IOTA  Tether Gold
  Zcash
Zcash  TrueUSD
  NEO
NEO  Polygon
  Decred
  Dash
Dash  Ravencoin
  Qtum
Qtum  Basic Attention
  Zilliqa
  0x Protocol
  Synthetix Network
  Holo
Holo  Siacoin
  DigiByte
  Enjin Coin
  Ontology
  Nano
Nano  Status
  Hive
Hive  Waves
Waves  Lisk
Lisk  Steem
Steem  Numeraire
  Pax Dollar
  BUSD
BUSD  Huobi
Huobi  NEM
NEM  OMG Network
  Bitcoin Gold
  Ren
Ren  Bitcoin Diamond
  Augur
Augur