Ethereum Price Analysis: Is ETH at Risk of $2,500 Reversal?

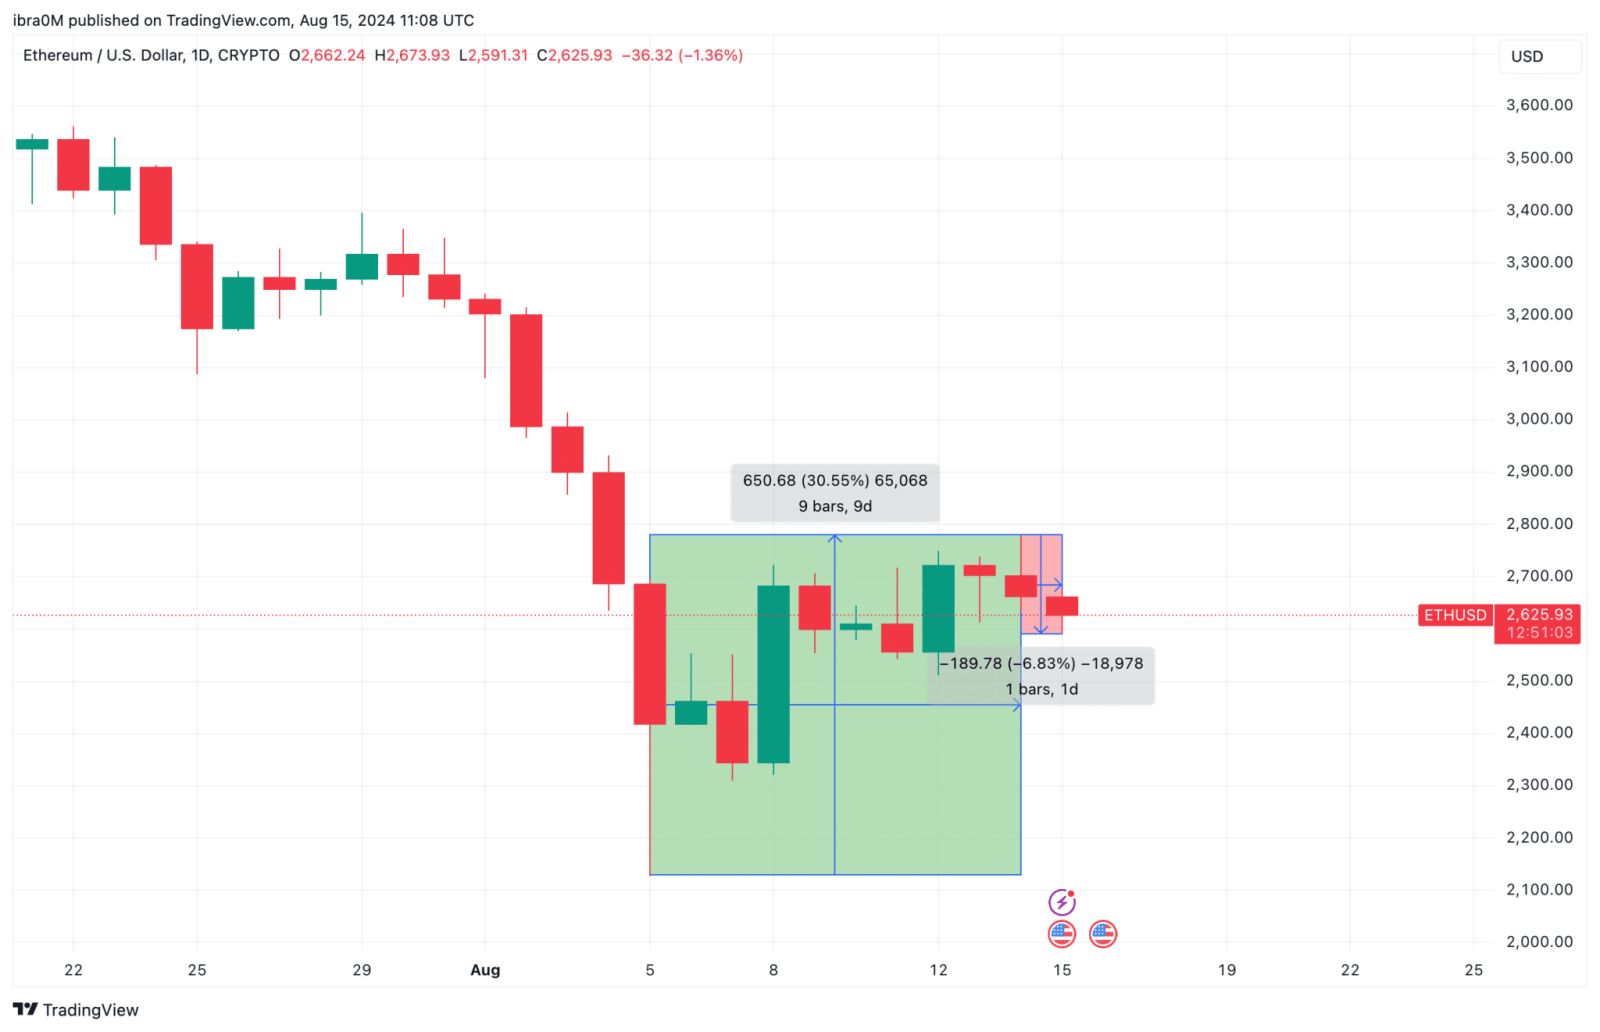
Ethereum price has retraced 6.83% in the last 24-hours after hitting $2,770 on Aug 14, market data shows how bearish headwinds from SHORT traders nullified the dovish US CPI impact.
ETH Price Tumbled 6.8% in 24 Hours
August began with uncertainty for Ethereum, but the price experienced steady upward momentum in the past week, largely attributed to Grayscale. The US-based investment firm sparked increased market demand after it announced the launch of new cryptocurrency trusts for SUI, TAO, and MKR.
This development, dated August 5, sparked optimism among investors, who saw it as a sign of deepening institutional adoption of crypto. This bullish sentiment extended to ETH, driving the price up by 30% between August 5 and August 14, as reflected in the chart.

Ethereum Price Analysis ETHUSD | TradingView
However, the release of dovish U.S. CPI data on August 14 shifted market dynamics. The initial optimism faded as investors turned their attention to the stock markets, causing a significant decline in cryptocurrency prices. The ETH price fell by 6% within 24 hours, erasing a large portion of its recent gains. The chart above shows how Ethereum stumbled as a result, with concerns mounting over a potential sharp correction in the coming days.
The market’s reaction suggests that Ethereum could now face increased bearish pressure, with derivatives markets hinting at further downside risks.
Short Traders Nullified the Dovish CPI
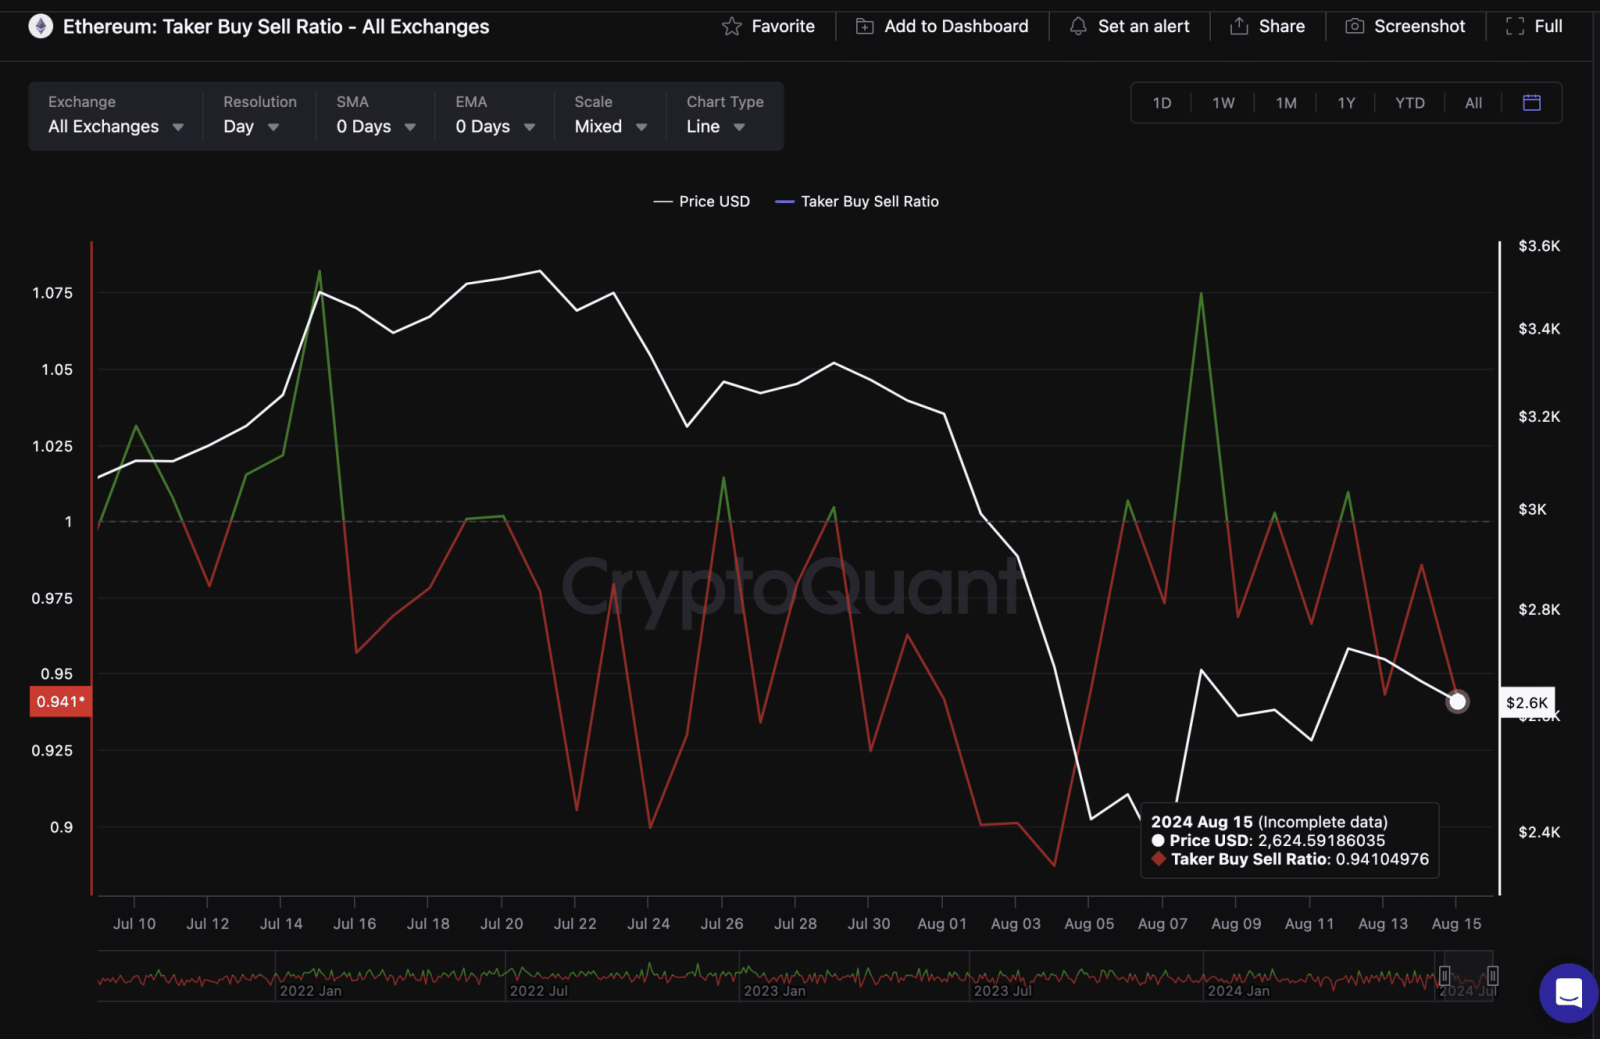
The initial optimism surrounding the CPI data was short-lived as bearish sentiment began to dominate Ethereum’s derivatives markets. A key indicator of this shift is the Taker Buy/Sell Ratio, which measures the ratio of buy orders to sell orders in the market.
The chart above illustrates how the Ethereum Taker Buy/Sell Ratio dropped significantly, from 1.07 on August 8 to 0.94 by August 14.

Ethereum Price vs ETH Taker BuySell Ratio | CryptoQuant
This shift signals a growing bearish sentiment among derivatives traders, who are increasingly betting against Ethereum. The decline in the ratio typically indicates that sell orders are outpacing buy orders, which is a bearish signal for the market.
Despite the dovish CPI, traders remain skeptical about Ethereum’s short-term prospects, suggesting that the recent rally might be unsustainable. With bearish sentiment prevailing in the derivatives markets, Ethereum’s price could potentially dip toward $2,500 in the coming days.
Ethereum Price Forecast: Bears Could Force a $2,500 Reversal
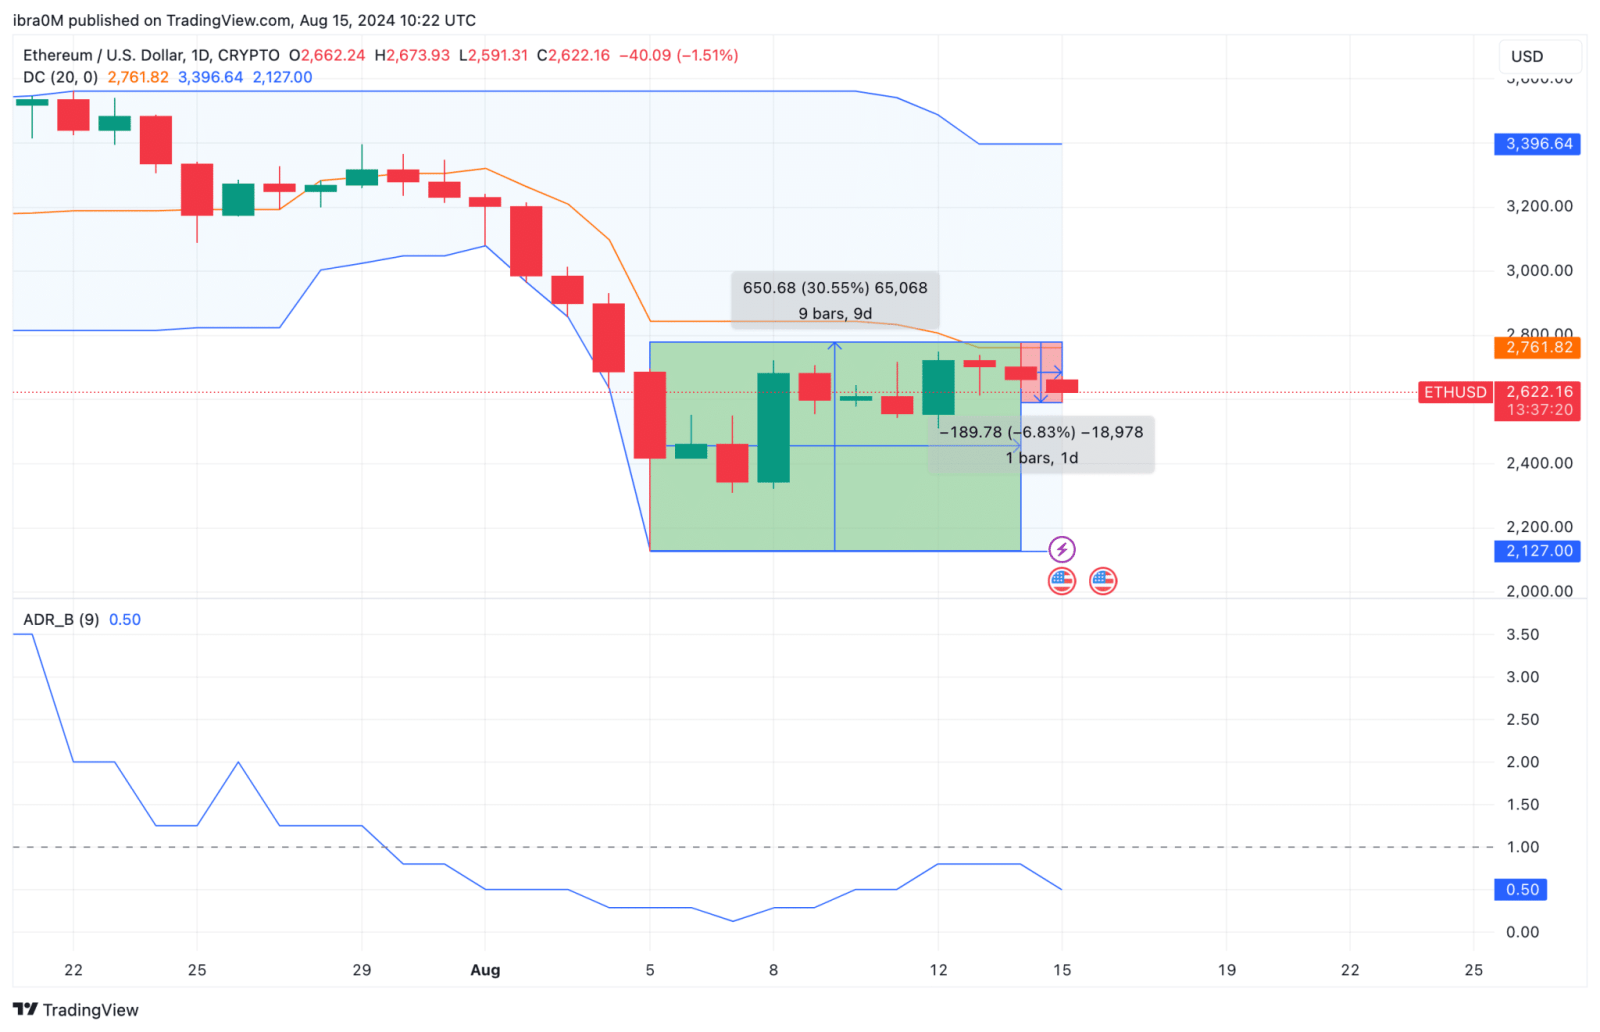
Ethereum’s price is currently struggling to maintain its recent gains, with technical indicators pointing to a potential reversal. The Donchian Channel indicator, as seen in the chart, shows that Ethereum’s price is hovering near the lower boundary, indicating strong resistance around $2,770. This level now serves as a key resistance point, with the price struggling to break above it.

Ethereum Price Forecast ETHUSD | TradingView
On the downside, support is visible around $2,500, as the chart suggests. If the bearish momentum continues, Ethereum could break below this support level, leading to a deeper correction. The Average Directional Index (ADR) further supports this bearish outlook, as it indicates a weakening trend. The combination of these factors suggests that Ethereum is at risk of a $2,500 reversal, with bears tightening their grip on the market.
In conclusion, Ethereum’s recent rally appears to be losing steam, with bearish sentiment in the derivatives markets and technical indicators pointing to a potential correction. If the bears maintain control, ETH could face a sharp decline toward $2,500 in the near term.


 Bitcoin
  Ethereum
  Tether
  USDC
USDC  Dogecoin
  TRON
TRON  Cardano
  Stellar
  Chainlink
  Hedera
  Bitcoin Cash
  Litecoin
  LEO Token
  Monero
  Cronos
  Dai
Dai  Ethereum Classic
  OKB
OKB  Algorand
  VeChain
  Cosmos Hub
  Gate
Gate  KuCoin
  Stacks
  Tezos
Tezos  Theta Network
  IOTA
IOTA  Tether Gold
  Zcash
Zcash  TrueUSD
  NEO
NEO  Polygon
  Decred
  Dash
Dash  Ravencoin
  Qtum
Qtum  Basic Attention
  Zilliqa
  0x Protocol
  Synthetix Network
  Holo
Holo  Siacoin
  DigiByte
  Enjin Coin
  Ontology
  Nano
Nano  Status
  Hive
Hive  Waves
Waves  Lisk
Lisk  Steem
Steem  Numeraire
  Pax Dollar
  BUSD
BUSD  Huobi
Huobi  NEM
NEM  OMG Network
  Bitcoin Gold
  Ren
Ren  Bitcoin Diamond
  Augur
Augur