Here is Why Ethereum Price May Shoot up Despite Major Declines

The available quantities of Ethereum tokens on exchanges have hit a new level, sparking predictions of a possible price increase.
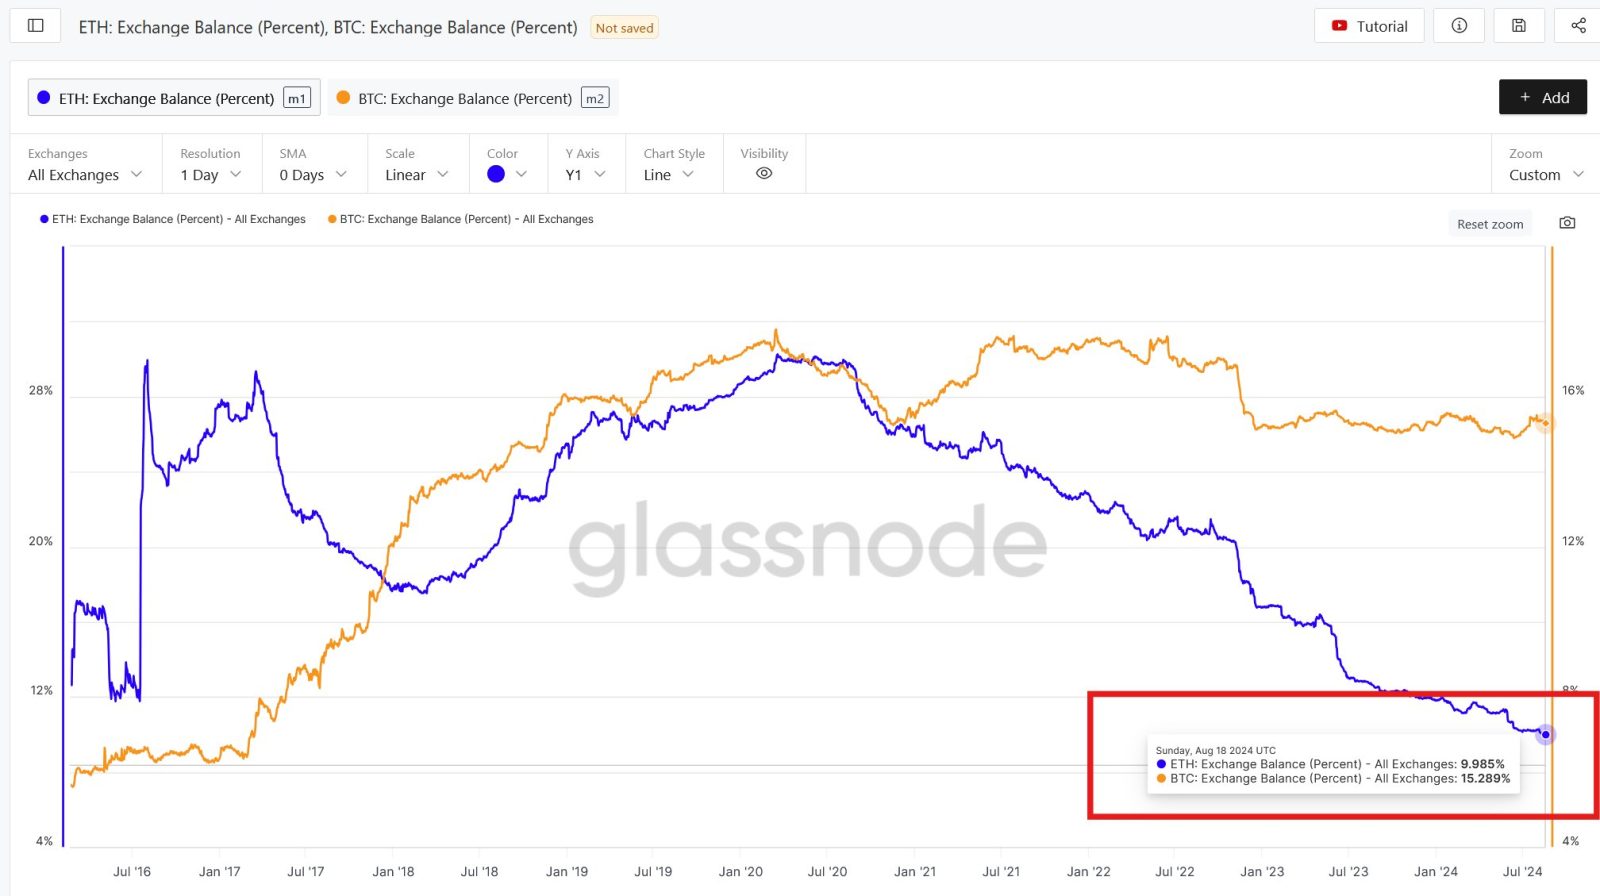
Notably, according to data presented by Leon Waidmann, Head of Research at OnchainHQ, Ethereum’s balance on exchanges has dropped below 10% for the first time. This marks a shift in Ethereum’s availability on trading platforms, leaving fewer tokens available for immediate trading.
Declining Supply on Exchanges
As seen from Waidmann’s post, the Ethereum exchange balance has undergone notable fluctuations since 2016. Initially, over 28% of Ethereum’s total supply was held on exchanges.
However, a sharp decline followed, with the balance dropping below 15% by early 2017. At this time, the amount of Bitcoin on exchanges was gradually going up, from below 10% in early 2017 to levels above 30% by 2020. Ethereum later mirrored Bitcoin’s pattern.

BTCETH Exchange Balances
After a brief increase in exchange balances, a sustained reduction began in late 2020 and has continued until today. Notably, this reduction correlated with the rise of Ethereum 2.0 staking after the launch of the Beacon Chain in December 2020.
By August 2024, the balance had dropped to 9.985% after about 34 million ETH tokens, or 28% of the Ethereum supply, had been staked.
Will The Price Shoot up?
As of this writing, Ethereum has less supply available on exchanges compared to Bitcoin. According to Waidmann, this reduced availability, combined with the expectation of increased demand for Ethereum, could lead to a potential price surge.
He speculates that as the demand for Ethereum rises, the limited supply on exchanges may drive its price upward, given the dynamics of supply and demand in the market.
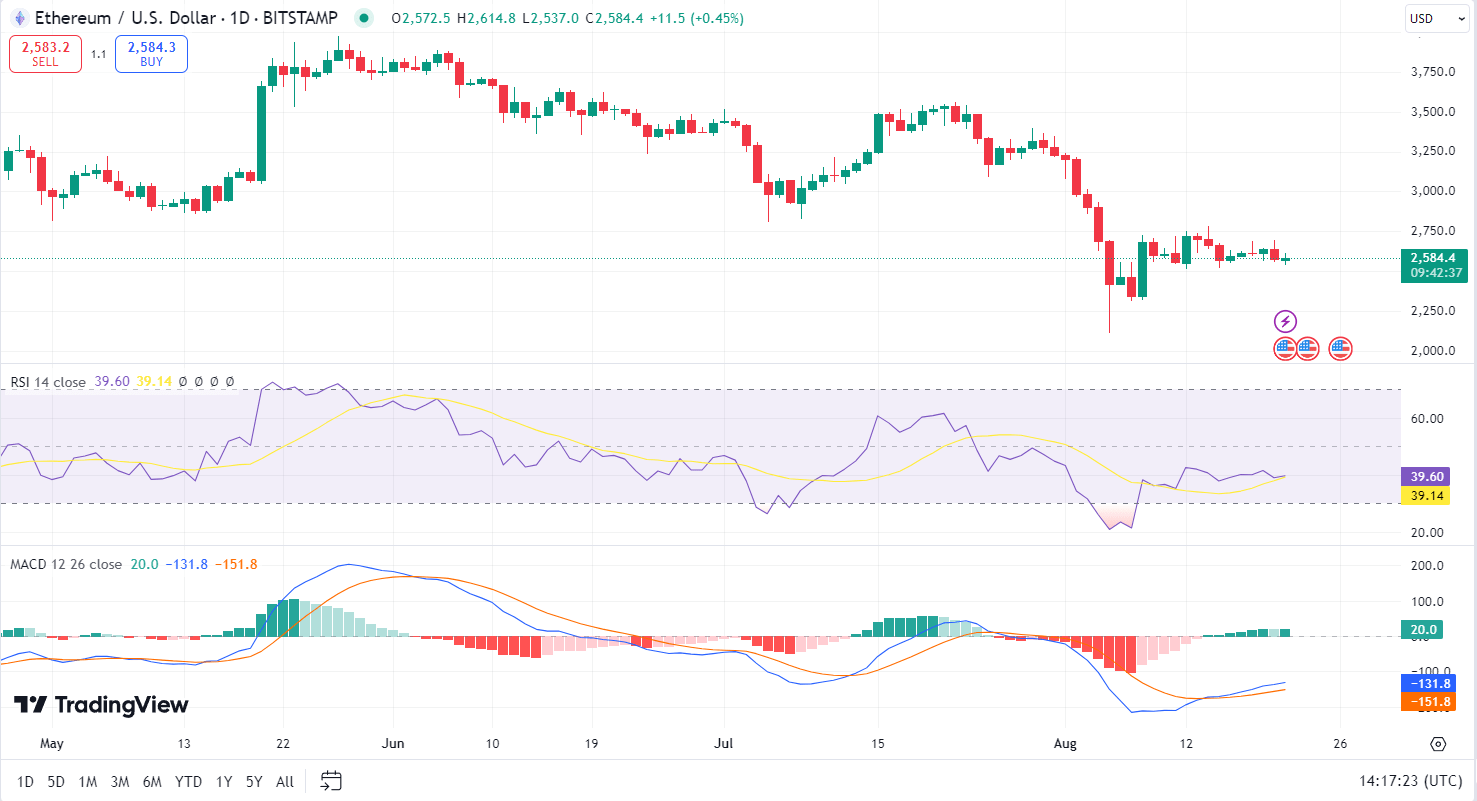
At press time, Ethereum was trading around $2,600, down over 25% from its monthly high.
Indicators Suggest a Possible Reversal
Market momentum indicators further suggest Ethereum may be poised for a price rebound. The Relative Strength Index (RSI), currently at 39.60, signals that Ethereum is moving closer to oversold territory.
While it hasn’t yet hit levels indicating a strong buy signal, the slight upward movement hints at a potential shift toward buying momentum.

ETH 1 day chart TradingView
Meanwhile, the Moving Average Convergence Divergence (MACD) indicator, which reflects trend direction, shows diminishing bearish momentum. As the MACD line crosses above the signal line, it signals a possible reversal in the recent downward trend.
Key Support Levels and Investor Profitability
However, amid the positive speculations, Ethereum faces a critical test at key support levels. Analysts have identified a significant support zone between $2,300 and $2,380, where around 50.38 million Ethereum tokens were held by 1.62 million addresses by August 16.
This concentration of holdings suggests that investors may strongly defend this price level.
Moreover, with Ethereum currently priced at $2,600, a majority of Ethereum holders remain in profit. Around 65.64% of all holders are currently “in the money,” reflecting the relative strength of Ethereum’s investor base.


 Bitcoin
  Ethereum
  Tether
  USDC
USDC  Dogecoin
  TRON
TRON  Cardano
  Stellar
  Chainlink
  Hedera
  Bitcoin Cash
  Litecoin
  LEO Token
  Monero
  Cronos
  Dai
Dai  Ethereum Classic
  OKB
OKB  Algorand
  VeChain
  Cosmos Hub
  Gate
Gate  KuCoin
  Stacks
  Tezos
Tezos  Theta Network
  IOTA
IOTA  Tether Gold
  Zcash
Zcash  TrueUSD
  NEO
NEO  Polygon
  Decred
  Dash
Dash  Ravencoin
  Qtum
Qtum  Basic Attention
  Zilliqa
  0x Protocol
  Synthetix Network
  Holo
Holo  Siacoin
  DigiByte
  Enjin Coin
  Ontology
  Nano
Nano  Status
  Hive
Hive  Waves
Waves  Lisk
Lisk  Steem
Steem  Numeraire
  Pax Dollar
  BUSD
BUSD  Huobi
Huobi  NEM
NEM  OMG Network
  Bitcoin Gold
  Ren
Ren  Bitcoin Diamond
  Augur
Augur